This deliverable describes the innovations installed in the A2A demonstrator as well as the main technical and economic aspects of those implementations, the measures for the implementation quality control, the commissioning of the demo site and initial operation.
Supervision ICT platform
The focus of the first version of the ICT platform was to create a functioning platform for data management, including functionality and accessibility for systems and users. The visualization part of the first version focused on the EnergyView platform and on demo site buildings.
From a fault detection perspective, the dynamic analysis was an important focus of the second version. The visualization tool, version 2 of the system added an integration with Google Data Studio and focused on 31 multi – family houses part of the mitigation actions. This tool provides a way to test different versions of visualization techniques in a business intelligence environment.
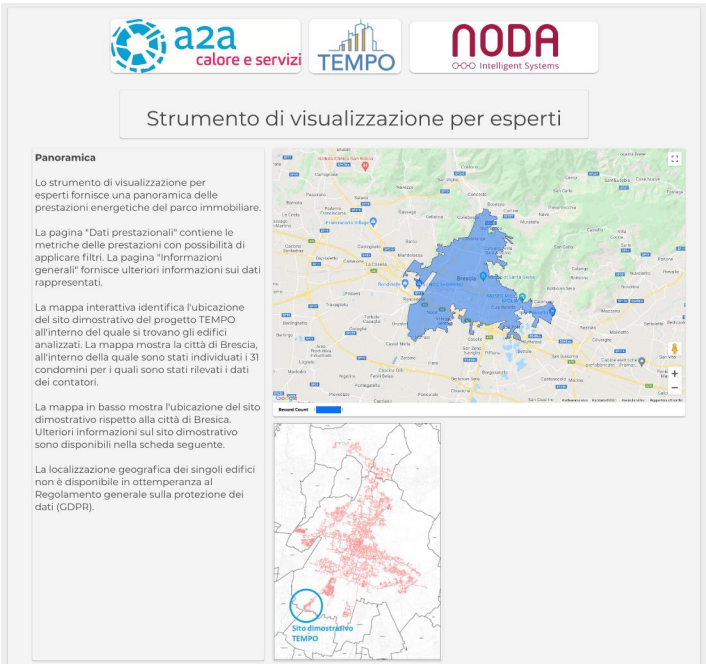
The primary visualization tool was based on the Data Studio dashboard. The dashboard is primarily focused on expert users, see Figure 1.
The front-end and ICT platform development have been performed according to industry software development standards. A result of the ICT analysis
and visualization is the so – called most wanted list. This shows the buildings with highest value of addressing in one or another way from an energy efficiency perspective. This is currently on-going work to provide access to this for the different building owners in the Brescia demo. Results will include a communications strategy from A2A towards the building managers; a set of easy to understand and short reports for all buildings based on V2 of the visualization tool and an evaluation of the response of the building managers and possible improvements.
The development of both the visualization front-ends, either EnergyView or Data Studio, and the ICT platform as such are spread out over the whole project. This makes it hard to quantify the development cost for the Brescia demo. However, it should be noted that the development costs are of one-time characteristic. This will facilitate post-project go-to-market in general.
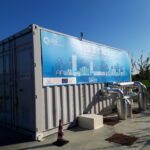
Smart DH controller:
The controller developed in TEMPO builds further on the STORM-controller. In essence, the STORM-controller is a demand side management system for DHC networks. It makes use of the thermal mass of the buildings connected to the DHC network. The controller is able to achieve 3 different control objectives (i.e. peak shaving, market interaction and cell-balancing). The STORM controller influences the power demand of a building: by overriding the outdoor temperature measurement, it ‘fools’ the control system of the substation by telling it that it is colder or warmer outside than it actually is. In TEMPO, additional functionalities were added; instead of only controlling the power, the objective of the TEMPO project is to control the network temperatures. Three different control strategies were developed and implemented.
- Return temperature minimization: By temporarily reducing the heat demand of connected buildings, it is possible to lower temporarily the return temperature.
- Supply temperature optimization: the water in the network pipes itself is used to store heat temporarily.
- Combination of supply and return temperature.
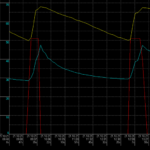
These three control strategies use a model predictive control framework. The inputs are forecasts of the outdoor temperature and the solar irradiation. The output of this control framework gives an optimal plan for the next 24 hours. These functionalities were recently integrated in the Brescia demonstration site, in order to be tested in the heating season 2021/2022.
In January 2020, the local supply temperature in the branch of the Brescia DH network containing the demo site was lowered progressively using a mixing station and the smart DHC controller was integrated. The experimental campaigns provided useful insights to develop the above mentioned data-driven models, which have been trained (15-minute resolution data) and tested with datasets from the 2020/2021 winter season.
First results on the return temperature minimisation show a reduction in return temperatures of up to 5°C on the secondary side (around 1.5 K on a daily average).
In the heating season 2020/2021, the smart DH controller yields in a small improvement as measured by normalized savings in primary energy consumption and greenhouse gas emissions.
The total cost of this innovation includes costs for equipment, the connection and installation costs as well as cost for the cloud storage. For the A2A demo site the total equipment costs (NODA boxes, temperature sensors, etc.) was around 6.000 Euro excluding installation costs. This number cannot be generalized for other district heating networks as it depends on the local situation. Besides these, the costs for the development and implementation of the smart DH controller are needed. However, these are case specific and cannot be generalized.
Optimization of the building installations
The return temperatures depend on the cooling taking place on the secondary side, which may be insufficient for a variety of reasons, including faults in the design or construction phase or in the operation of the system. For the detection of anomalous substations, a variety of methods is available. These methods often make it possible to identify suboptimal behaviour, but not to assess or predict its causes, or to provide indications concerning further diagnosis and resolution steps. Compared to the state of the art, one distinctive feature of the TEMPO innovation was a general investigation of situations leading to high return temperatures and their modelling in coupled building and system simulations. Several improvements were made in version 2 as compared to version 1, including continuous improvements in terms of simulation models, calibration of simulations and adjustments to the practical guide. The main improvements were:
- Fault detection and diagnosis with new algorithms and for shorter periods;
- Interactive guide for technical audit of building installations in the form of a web page;
- Connecting fault predictions with the guide: Having a web version of the guide for technical audit of building installations made it possible to establish a connection between two outcomes of the innovation, which were not yet connected in version 1.
Two related functions are combined: the simulation-based fault detection and diagnosis for secondary systems and the guide for auditing building installations. Simulation-based fault detection and diagnosis is based on data-driven algorithms, which have been trained on simulation data and are applied on monitoring data from the individual substations. The predictions made by the algorithms for a given period are summarized in an HTML document. This document also includes links to relevant sections of the guide for auditing building installations.
By contributing to the elimination of faults in building installation, the return temperature can be lowered and the energy efficiency can be increased. It also appears to be complementary to the other innovations, as faults in building installations compromise the ability to apply smart controls and other advanced strategies. For those buildings, where the installation optimizations cannot be implemented within the project duration, a simulation-based evaluation of the effects of building installation optimization will be carried out.
Access the final report here: D4.3 Integrated Improved Innovations in a2a Network.