The deliverable D3.3 of the TEMPO project is a report on the integrated improved innovations in the Windsbach demo site.
There are five innovations that had to be evaluated for the report:
- Supervision ICT platform
- Visualization tools
- Decentralized buffers
- Smart district heating controller
- Optimization of building installation
- The supervision ICT platform was enhanced to include script management. Having the ability for such script management greatly enhances the usability of an ICT data management platform, and supports scalability since such scripts can be re-used to create the required behaviour on the different levels of the data management process.
Furthermore, for the second version of the ICT platform, the focus has been to implement tools for improved data management. This included improved functionality for extraction when dealing with necessary cross-referencing and error handling, transformation of sensors names and units of measure including removal of repeated values and outliers based on standard deviation, resampling on desired time resolution, interpolation over shorter periods of time to supply missing values and computation of synthetic values. These are all tools that support the general usability of the data management system.
2. The primary visualization tool for the work in Windsbach is the EnergyView system. The visualization tools, that are already being used by several project partners, now feature a customizable widget system, and an improved alarm system.
3. Installing decentralized buffers in each dwelling allowed for a comparatively slim design of the district heating network. The first two phases of the development area are completed to a large degree, and there seem to be no signs for supply shortages. The network flow temperature could be reduced significantly, from 80°C in a baseline-scenario to 65-72°C. However, the original concept behind the heating network with the centralized buffers aimed for a significantly lower return temperature. There are a couple of issues increasing said return temperature, e.g. badly manufactured short return lances, heating systems with elevated temperatures inside several dwellings, and a rather remote multi-family house requiring an elevated temperature level for its apartment stations, sending back high temperature. The same multi-family house requires high network flow temperatures, that could otherwise be further reduced. Nevertheless, the return temperature would be even higher in a network with secondary instead of primary storage buffers. Several consumers with flawless performance (including low return temperatures) show that the initial assumptions might be met (or at least approached) in a network with reasonably designed and executed building installations. The improved decentralized buffers allow low district heating return temperatures:
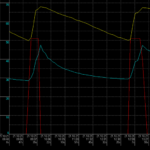
Test results of the decentralised buffer – the degree of opening of the primary valve (red, %), the buffer top temperature (yellow, °C) and buffer bottom temperature (blue, °C).
4. Smart DHN controller:
By applying the theoretical algorithms that were developed in WP1 into the Windsbach demo of WP3, we encountered many practical and technical challenges.
At first, the optimization algorithm needs to be controlling a system which is already operated with a conventional controller, e.g. the Schneid controller in Windsbach. The behavior of this controller was different than the assumptions made in WP1, e.g. the backup controller did not safeguard end-user comfort if the smart controller was sending out non-optimal control signals. Due to this, a new optimal control approach, purely data-driven, was defined, implemented and deployed. In order to get the calculated control signal of this approach applied on a distributed buffer, four different platforms are used. The signal gets calculated on a VITO server, where it sent to the EnergyView platform. In the EnergyView platform another piece of software is running to export the control signals out of EnergyView, at the defined times, and send them to the Schneid system. The Schneid system in the end sends the charging signals to the buffers. This workflow implies that there are four different places where errors can occur and each of the systems has its own expert and responsible person. In order to debug the whole system, different people are needed.
As a result, in the majority of the cases it takes longer to locate the problem than to solve it. In that sense, it would be better if the conventional controller is able to receive external control signals and apply them directly to the devices in the system (if comfort is not jeopardized). This would rule out two of the four systems, doubling the debugging efficiency. In an ideal world, the installed system together with its operating software, would be designed in cooperation with the company responsible for deploying the smart controller. However, in the majority of the cases this is not feasible as the DHN and its controller are already in operation at the time the smart controller is defined. Therefore, the 20%-80% rule certainly applies when deploying a control algorithm in practice, e.g. 20% of the time is needed to develop the algorithm and 80% is needed to get it up and running in the field.
5. Building installation optimisation:
Several improvements were made in version 2 as compared to version 1, including continuous improvements in terms of simulation models, calibration of simulations and adjustments to the practical guide, but the main improvements were as follows:
- Fault detection and diagnosis with new algorithms and for shorter periods.
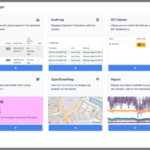
- Interactive guide for technical audit of building installations: Whereas in version 1 the practical guide for technical audit of building installations was a static (PDF) document, in version 2 it has become a more interactive guide in the form of a web page. This web page makes the exploration of the guide easier by providing a variety of links.
- Connecting fault predictions with the guide: Having a web version of the guide for technical audit of building installations made it possible to establish a connection between two outcomes of the innovation which were not yet connected in version 1: the fault predictions made for given data and the guide. In version 2, the fault predictions resulting from the application of the simulation-trained fault detection and diagnosis algorithms to actual monitoring data are summarized in reports. These reports refer to fault types and metrics for which links to the guide are provided, enabling a combination of the (automated) data-driven insights with the (manual) audit process.
The predictions made by the algorithms for a given period are summarized in an HTML document along with metrics calculated for the period.
This document also includes links to relevant sections of the guide for auditing building installations. Identifying and remediating faults in building installations can result in very significant performance improvements, especially concerning district heating return temperature.
Read the full report here.